Testimony to Senate Committee on Economic Development
Regarding the Committee's Bill on Housing
Samantha Sheehan, Municipal Policy and Advocacy Specialist, VLCT
March 19, 2025
Mobile and Manufactured Homes Preemption
VLCT does not prescribe housing types, communities should build the type of homes at the density they need, envision, and allow
Policies to expand Act 250 exemption and support the creation and extension of public infrastructure support the use of manufactured home types
There is significant existing housing stock of these types, especially in communities without zoning, 6% statewide and up to 12% in Grand Isle County, the median Vermont mobile home with land sold for $130,000 in 2023
VLCT support provision in H.479 allowing municipalities to adopt preemptions to local bylaw without a public hearing
Municipal Zoning Preemptions
VLCT supports the option to adopt zoning preemtions without a hearing. Municipalities are on track to implement Act 47 and Act 181, with only 13% of survey respondents reporting they have “not started”. Reasons include: other priorities, lack of technical assistance (TA), lack of funding.
Infrastructure Needs
In VLCT’s membership survey last October, 35 municipalities reported that they currently have plans to build or expand municipal water or sewer systems. From those 35 projects:
28% have received some state funding, 16% have received some federal funding.
The average total cost for the project is about $14 million, the median is about $10.2 million
Anticipated date of completion from 2025 to 2030
Total anticipated costs from all survey respondents is $393,871,000 and the funding secured to date is $151,912,000.
That means that Vermont needs to find over $240 million just to meet expected costs for local infrastructure projects underway.
Infrastructure Sustainability Fund
VLCT supports investments for municipal infrastructure to enable housing
Eligible activities: VLCT survey found the top three needs for funding assistance were construction, planning and design, and project management (including finance/grants management)
Development of new housing increases grand list revenue
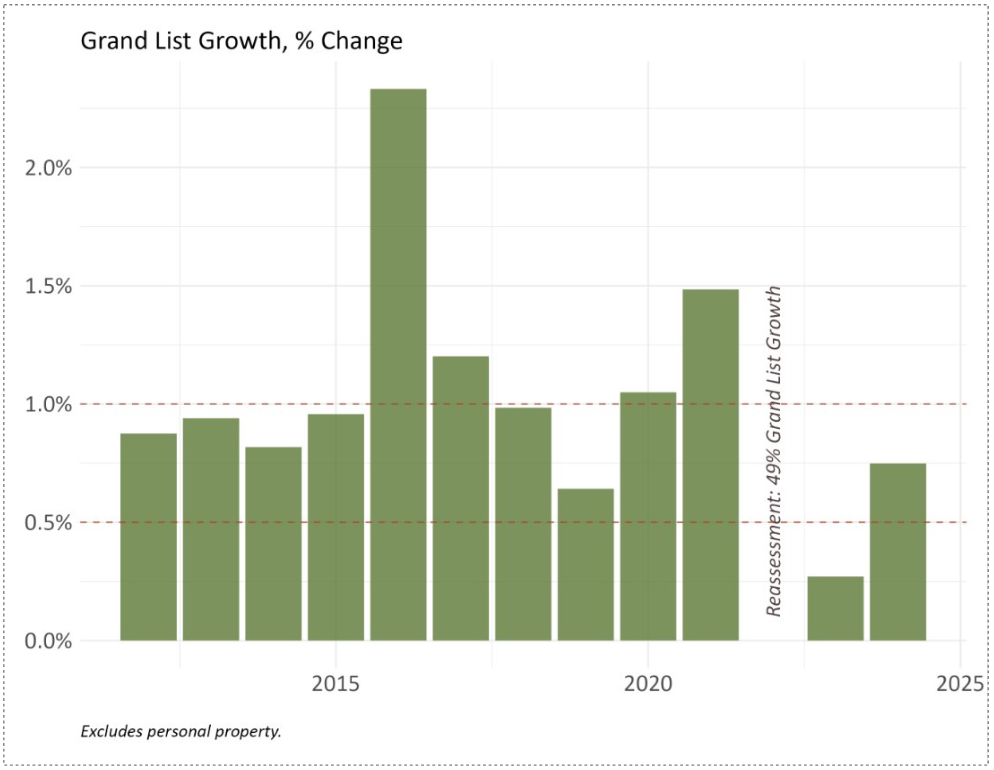
Annual municipal grand list growth (apart from revaluation) is understood to be around or below .8% – 3%
Per VHFA, Between 2010-2020 Vermont’s housing stock increased by an average rate of 0.4% (1,178 homes per year)
Considerations for Tax Increment (CHIP)
VLCT supports Tax Increment Financing to fund public infrastructure for housing.
Prioritize housing and consider flood resiliency for program eligibility
Include opportunities for all municipalities to fund critical infrastructure and realize housing development, regardless of Tier 1 status
Tax increment formula for state and local property tax that supports new development and redevelopment projects
Stable and immediate contributions to the Education Fund
Pair appropriate technical support for municipalities
Understanding Grand List Growth
To assess background growth for the purpose of analyzing the potential impacts of the CHIP proposal, it is problematic to include grand list growth from revaluation because revaluation is tax revenue neutral. We must assess grand list growth from development or renovation.
The equalization study (CLA) is a method of revaluation based on current fair market value
Scarcity of housing inflates the value of homes
Revaluation does not affect the amount of property tax revenue to the Education Fund
Development of new housing increases grand list revenue
Annual municipal grand list growth (apart from revaluation) is understood to be around or below .8% – 3%
Per VHFA, between 2010 and 2020 Vermont’s housing stock increased by an average rate of 0.4% (1,178 homes per year)
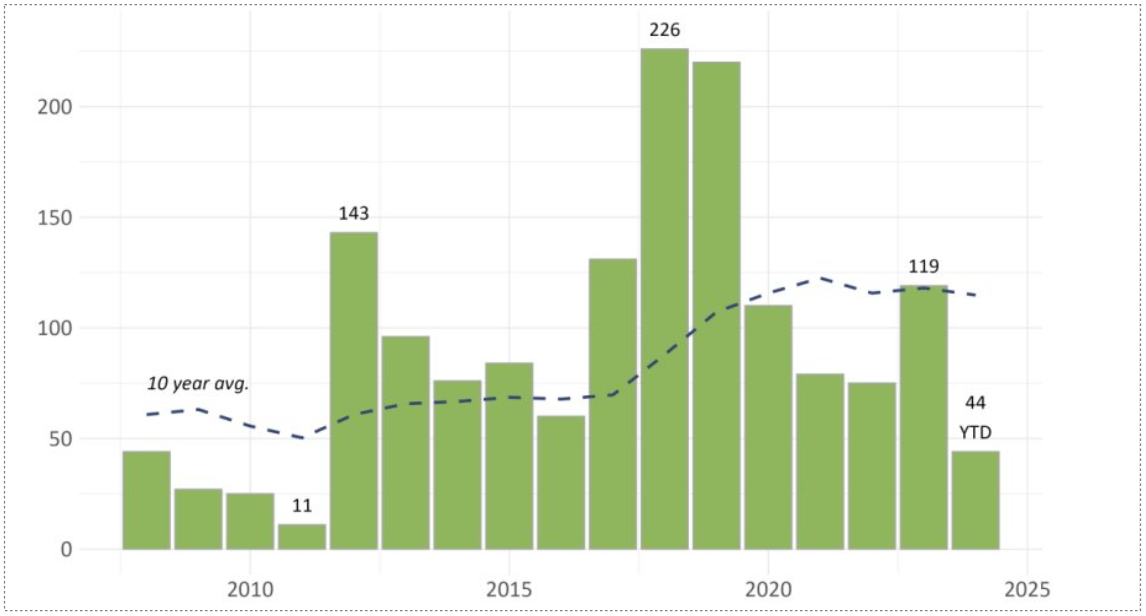
New Housing Units Constructed in Burlington, Per Year
In 2012, the ten-year average was 61 new units per year; in 2023, this average was 119 units per year – about a 200% increase in rate of development.
Percent of Grand List Growth in Burlington, Controlled for Reappraisal