Testimony to the House Commerce Committee
Regarding S.127 on Housing and the CHIP Funding Proposal
Josh Hanford, Director of Intergovernmental Affairs
Samantha Sheehan, Municipal Policy and Advocacy Specialist
April 16, 2024
Infrastructure Needs
In VLCT’s membership survey last October, 35 municipalities reported that they currently have plans to build or expand municipal water or sewer systems. From those 35 projects:
- 28% have received some state funding, 16% have received some federal funding.
- The average total cost for the project is about $14 million, the median is about $10.2 million.
- Anticipated date of completion from 2025 to 2030.
- Total anticipated costs from all survey respondents is $393,871,000 and the funding secured to date is $151,912,000.
Funding Public Infrastructure with Tax Increment
VLCT has identified a more than $240 million public funding gap for existing water and sewer projects. CHIP isn't the best proposal to fund these projects, it's the only proposal.
- Recent reforms to Act 250 (Act 181) have bound future housing density to municipal water and sewer.
- CHIP allows municipalities to fund this infrastructure without raising taxes or rates on existing homeowners.
- CHIP enables the State to support this investment without a general fund appropriation.
- CHIP provides a stable and immediate increase in revenue to the state education fund (existing tax base + 20% of new increment).
- CHIP creates a new financing tool all communities can use from local revenue increment to fund public infrastructure.
Other Municipal Considerations For CHIP design:
CHIP is, fundamentally, a change in municipal financing authority.
- VLCT supports provision to allow "sponsors" to acquire debt
- Public interests are protected through the Housing Infrastructure Agreement
- Public improvements at a given parcel increase property value and generate new tax increment annually on April 1
- VLCT does not support a "but for test"
- New housing, public infrastructure, and flood resilliency improvements are plainly for the public good
CHIP Supports Housing in All Communities
Considerations for rural and low resource towns:
- CHIP is housing type agnostic, building all types of housing for all incomes is for the public good.
- Eligible public improvements include "flood remediation and mitigation".
- Includes opportunities for all municipalities: Tier 1a, Tier 1b, Tier 2, or "an existing settlement or an area within one-half mile of an existing settlement".
- Pairs appropriate technical support for municipalities: "Related costs may include direct municipal expenses such as departmental or personnel costs related to creating or administering the housing infrastructure project"
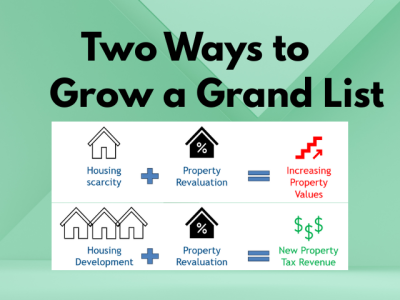
How Does a Grand List Grow?
To understand the benefit of tax increment financing we must assess grand list growth from development, not from revaluation.
Understanding "Real" Grand List Growth
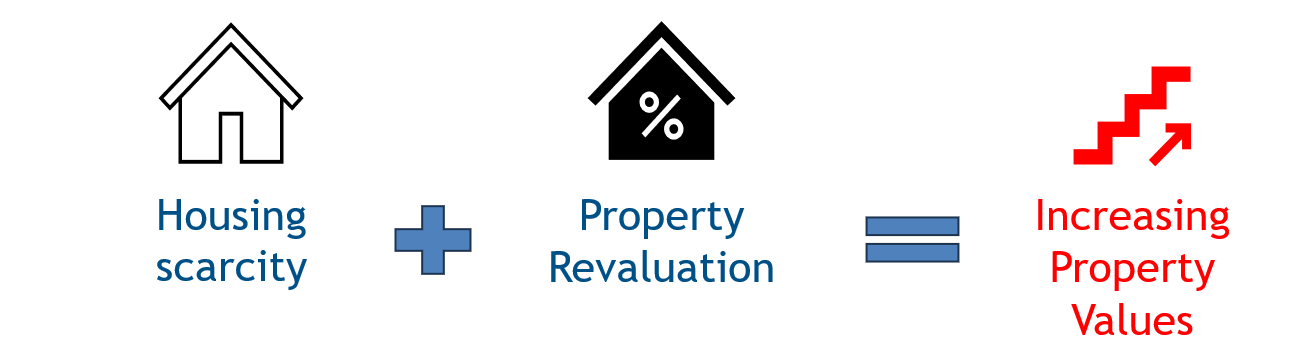
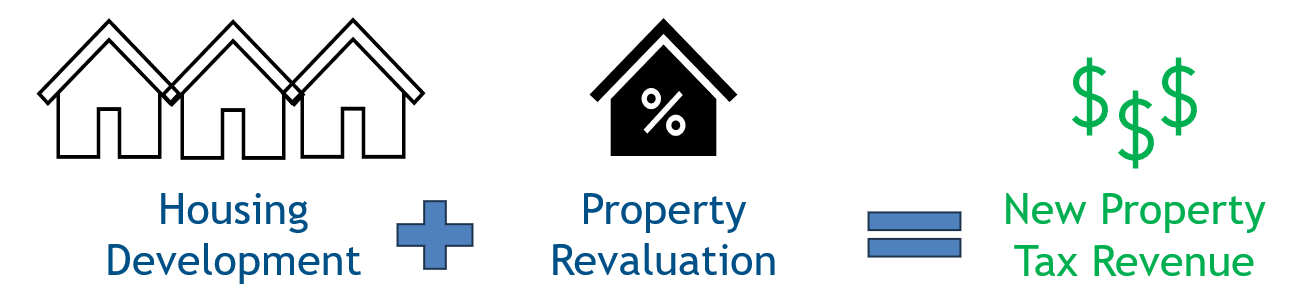
Property revaluation is tax revenue neutral. Property revaluation after redevelopment creates new tax revenue. Revaluation does not change the amount of revenue to the Education Fund, Development does.
- Mass reappraisal and the equalization study (CLA) are methods of property revaluation based on current fair market value for existing development.
- In fiscal year 2025 and 2026, equalized grand list growth is expected to be approximately 14%.
- Annual municipal grand list growth from development or property improvements is understood to be about .8%–3%.
- Between 2010 and 2020, Vermont’s housing stock statewide increased by an average rate of 0.4% per year (1,178 homes).
Example 1: Impacts of New Development on Burlington's Grand List Value
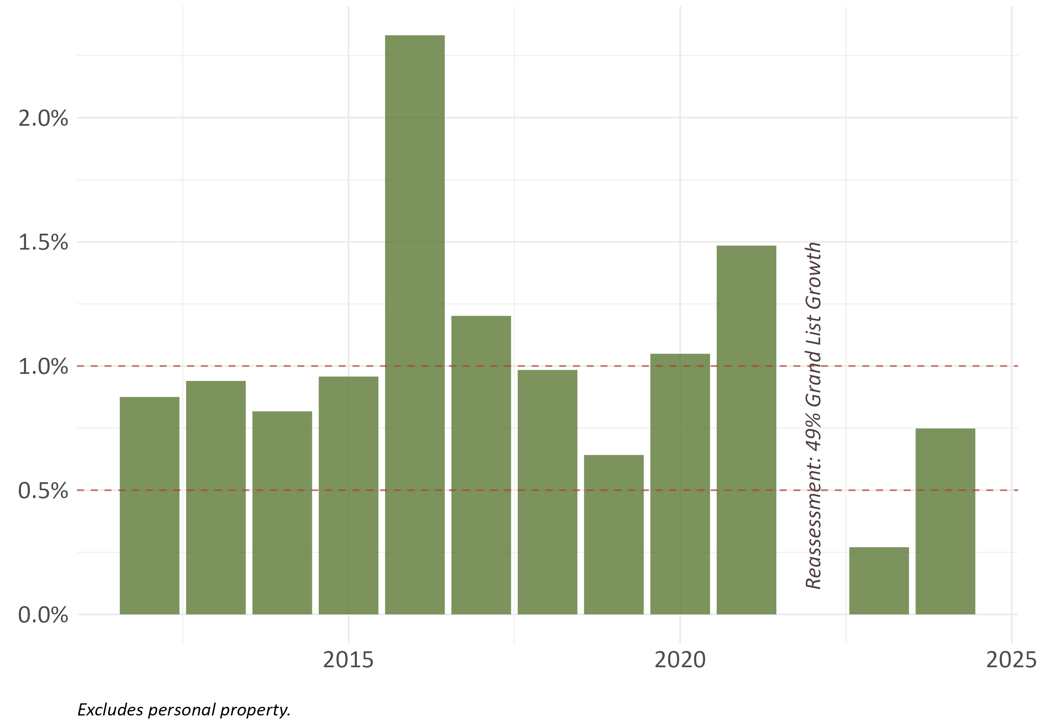
In 2012, the ten-year average was 61 new units per year. In 2023, this average was 119 units per year – about a 200% increase in rate of development.
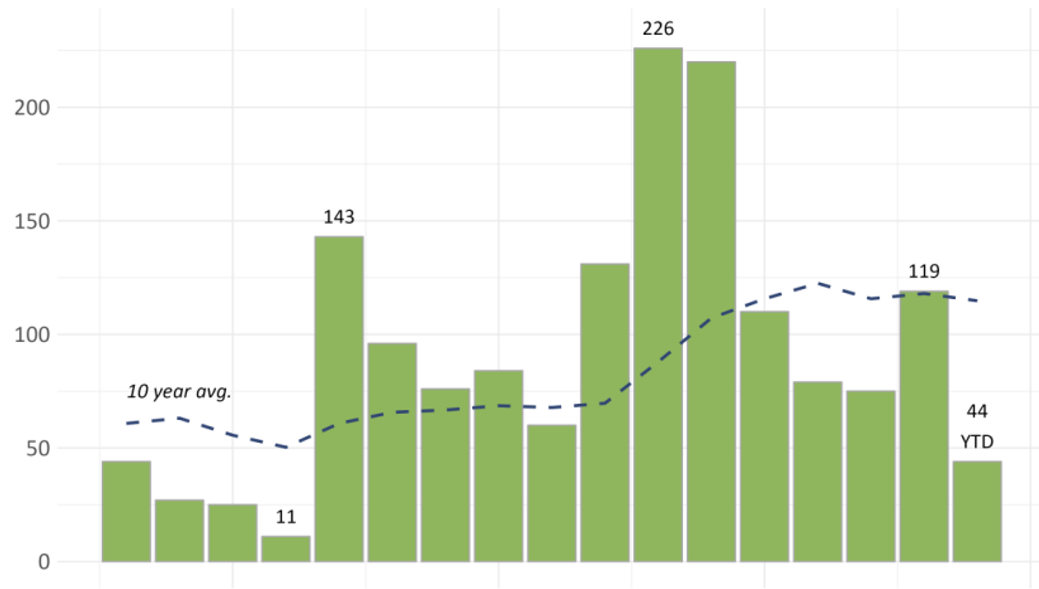
With a 200% increase in the rate of new housing units per year, Burlington only experienced an annual rate of grand list above 2% one time.
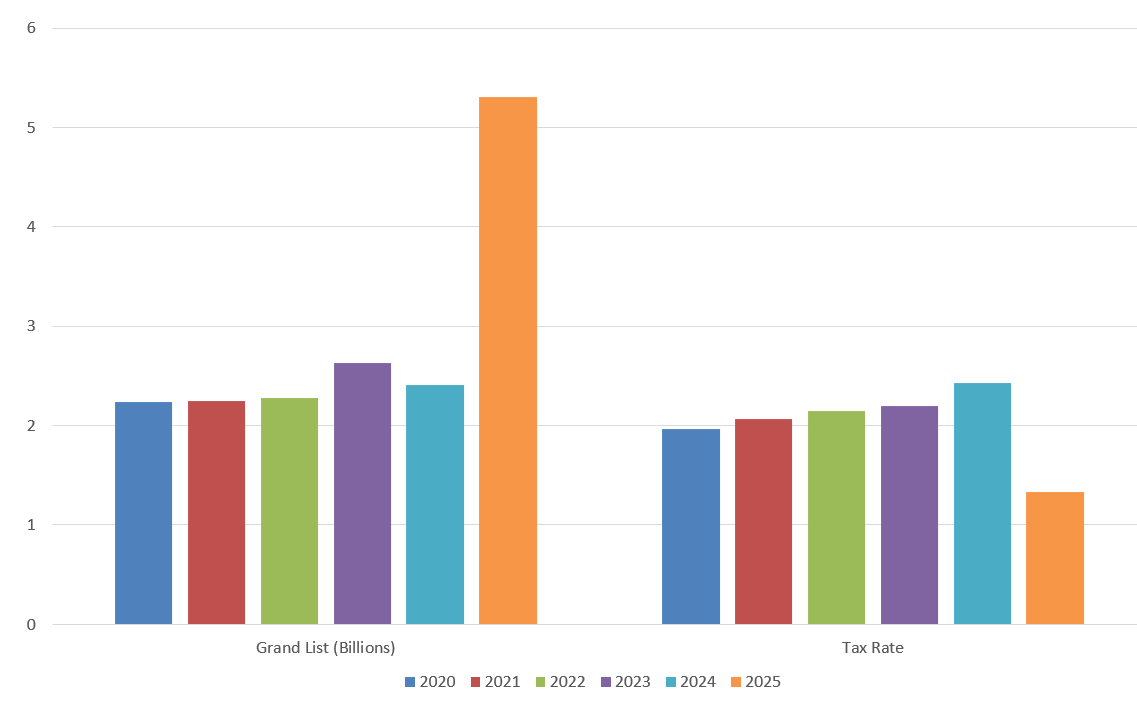
Example 2: Revenue Neutral Reappraisal in Stowe
When Stowe complete a municipality-wide reappraisal in 2024, the grand list value jumped from $2 billion to $5.5 billion. Despite a significant increase that year in the school budget, Stowe’s homestead education property tax rate dropped from 2.43 to 1.33.